Building a Smart Home IoT Dashboard with ESP32 and React
Complete guide to creating a real-time IoT dashboard that monitors temperature, humidity, and motion sensors using ESP32 microcontrollers and a modern React frontend.
Building a Smart Home IoT Dashboard with ESP32 and React
In this comprehensive tutorial, we'll build a complete IoT solution that bridges the physical and digital worlds. Our project combines ESP32 microcontrollers for sensor data collection with a React-based web dashboard for real-time monitoring and control.
Project Overview
This project demonstrates how to create a scalable IoT architecture using:
- ESP32 microcontrollers for sensor interfacing
- MQTT protocol for reliable communication
- Node.js backend with WebSocket support
- React frontend with real-time data visualization
- MongoDB for historical data storage
Hardware Requirements
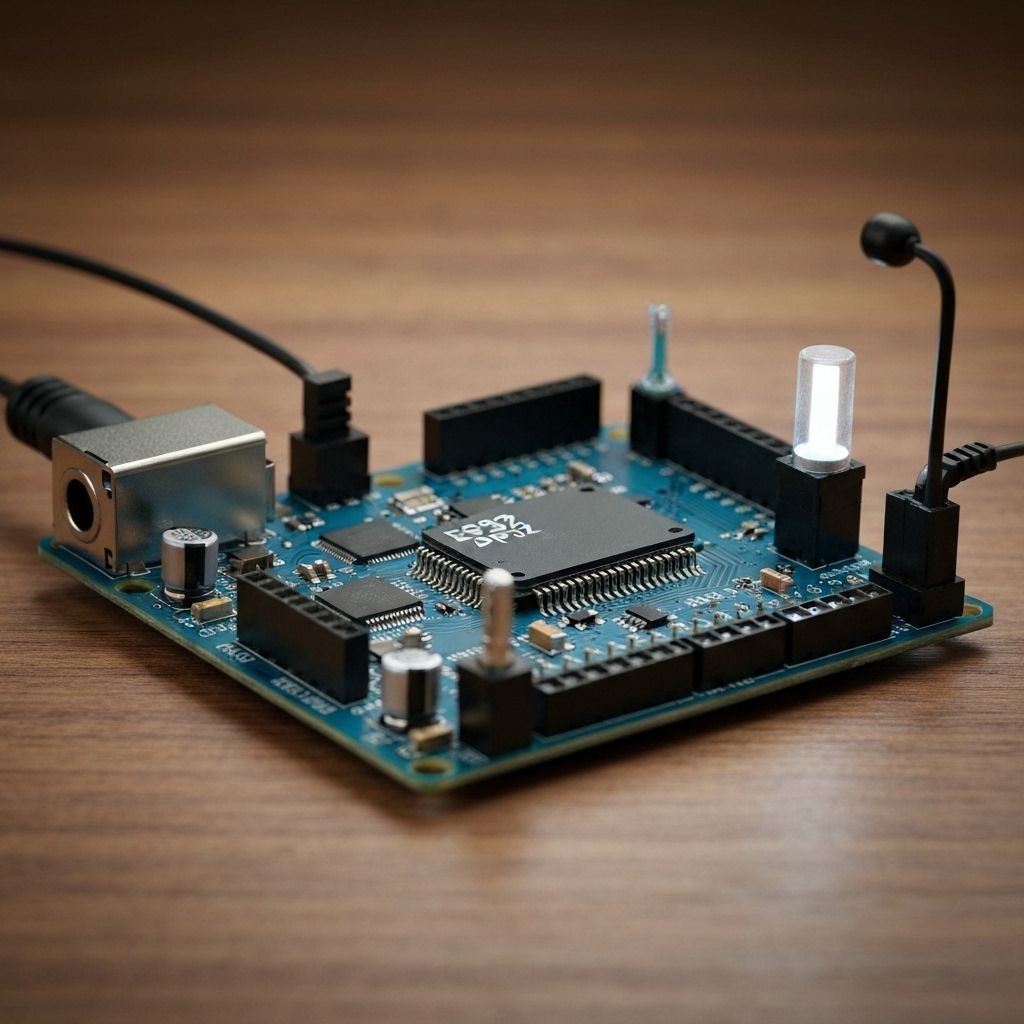
ESP32 Development Board
The ESP32 is our microcontroller of choice due to its built-in Wi-Fi capabilities, dual-core processor, and extensive GPIO pins. We'll use the DOIT ESP32 DevKit V1 for this project.
Sensors Used
- DHT22: Temperature and humidity monitoring
- PIR Motion Sensor: Movement detection
- MQ-2 Gas Sensor: Air quality monitoring
- LDR (Light Dependent Resistor): Ambient light detection
- Relay Module: For controlling AC appliances
Circuit Design and Wiring
The ESP32 GPIO pins are connected as follows:
DHT22 Data Pin → GPIO 4
PIR Motion Sensor → GPIO 5
MQ-2 Analog Output → GPIO 34 (ADC1_CH6)
LDR → GPIO 35 (ADC1_CH7)
Relay Control → GPIO 2
Pro Tip: Always use pull-up resistors (10kΩ) for digital sensors to ensure stable readings and prevent floating inputs.
ESP32 Arduino Code
#include <WiFi.h>
#include <PubSubClient.h>
#include <DHT.h>

#define DHT_PIN 4
#define DHT_TYPE DHT22

DHT dht(DHT_PIN, DHT_TYPE);
WiFiClient espClient;
PubSubClient client(espClient);

const char* ssid = "your_wifi_ssid";
const char* password = "your_wifi_password";
const char* mqtt_server = "192.168.1.100";

void setup() {
  Serial.begin(115200);
  dht.begin();

  WiFi.begin(ssid, password);
  while (WiFi.status() != WL_CONNECTED) {
    delay(500);
    Serial.print(".");
  }

  client.setServer(mqtt_server, 1883);
}

void loop() {
  if (!client.connected()) {
    reconnect();
  }
  client.loop();

  float temp = dht.readTemperature();
  float humidity = dht.readHumidity();

  String payload = "{\"temperature\":" + String(temp) +
                   ",\"humidity\":" + String(humidity) + "}";

  client.publish("sensors/data", payload.c_str());

  delay(30000); // Send every 30 seconds
}
React Dashboard Implementation
The React frontend provides real-time visualization using Chart.js and Socket.IO for displaying sensor data in interactive charts and gauges.
Conclusion
This IoT dashboard project demonstrates a complete end-to-end solution for smart home monitoring. The modular architecture allows for easy expansion with additional sensors and provides a robust foundation for IoT applications.

Manish Bookreader
Electronics enthusiast, Embedded Systems Expert, Linux/Networking programmer, and Software Engineer passionate about AI, electronics, books, and cooking.
