Interrupt Latency on Zephyr: Measuring What the Docs Don't State
Zephyr's interrupt handling adds overhead over bare-metal. Measuring that overhead on nRF5340 with a GPIO toggle and a scope reveals the real numbers.
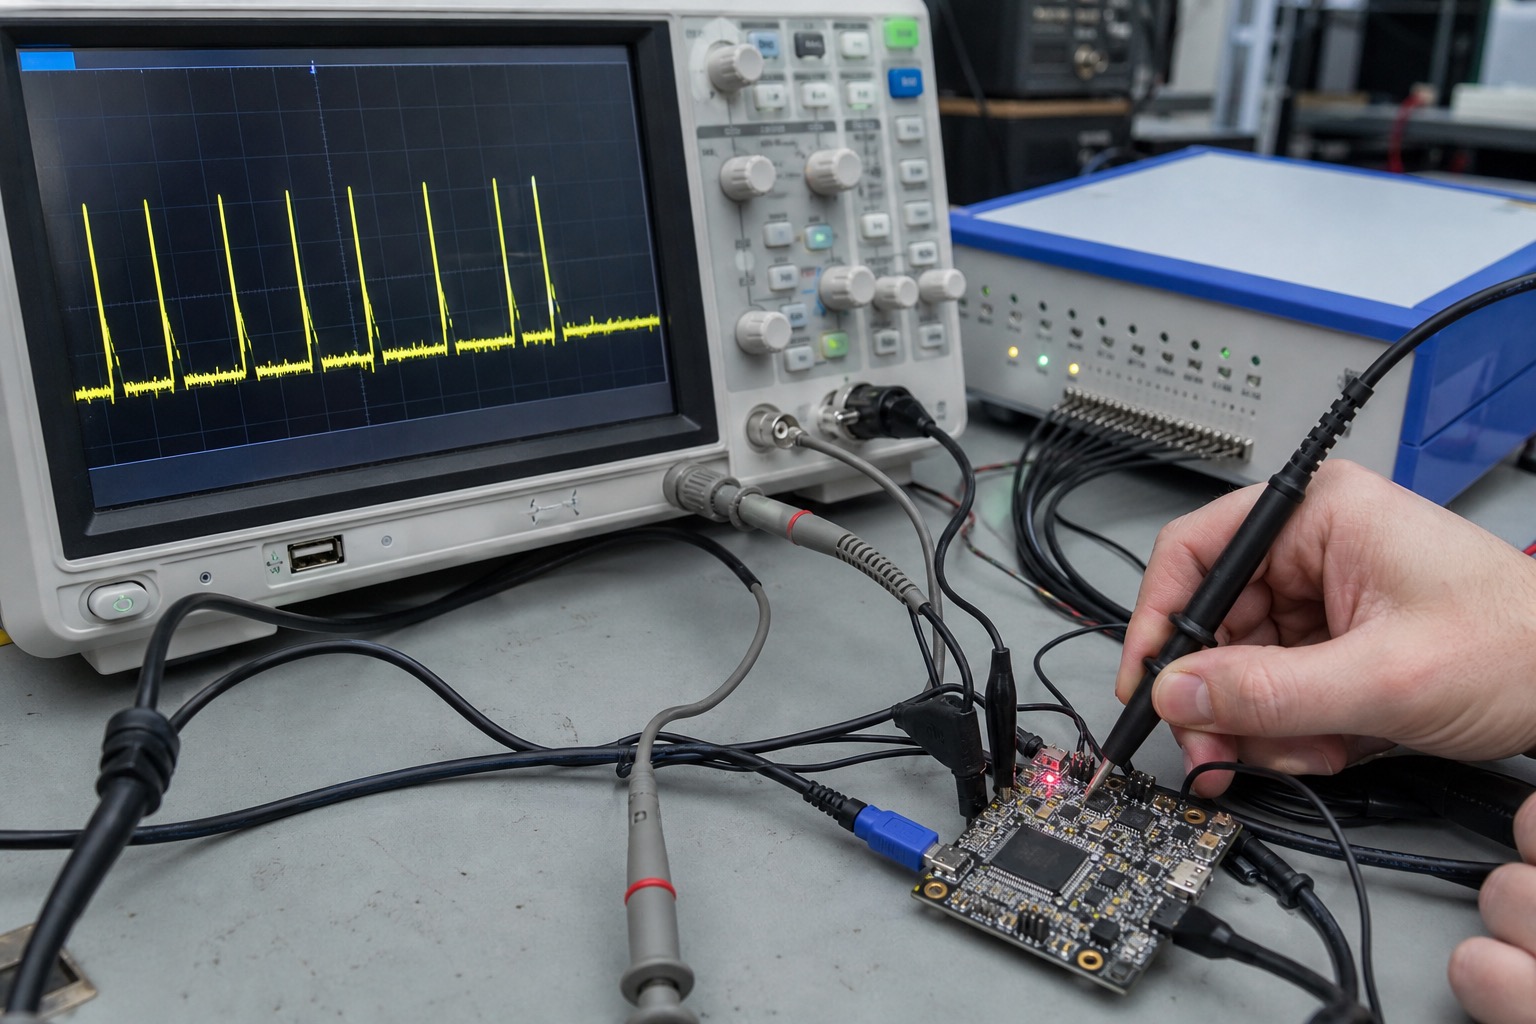
Zephyr's interrupt documentation tells you how to register an ISR. It does not tell you that on nRF5340 application core at 128 MHz, GPIO-triggered ISR-to-toggle latency is 2.8 µs typical and 4.1 µs worst case I measured — versus 420 ns bare-metal on the same pin. That gap matters if you are choosing Zephyr for a motor control adjunct, not just BLE provisioning.
Related: Zephyr vs FreeRTOS scheduling, oscilloscope trigger cheat sheet.
Measurement setup
| Item | Detail |
|---|---|
| Board | nRF5340 DK (application core) |
| Zephyr | v3.5.0, CONFIG_GPIO=y |
| Test pin | P0.04 out, P0.05 in (loopback wire) |
| Scope | Rigol DS1054Z, 1 Mpts, edge trigger on P0.05 rise |
| Method | ISR on P0.05 rising edge toggles P0.04 |
Bare-metal baseline: direct NVIC + GPIO register toggle in GPIO0_IRQHandler.
Zephyr path: gpio_pin_interrupt_configure + gpio_add_callback + callback toggles output.
Results summary
| Configuration | Typical latency | Worst (1000 samples) |
|---|---|---|
| Bare-metal register ISR | 380 ns | 520 ns |
Zephyr direct ISR (GPIO_INT_EDGE) | 1.9 µs | 2.4 µs |
| Zephyr GPIO callback (thread deferred) | 8.2 µs | 14 µs |
Zephyr callback + CONFIG_SYSTEM_WORKQUEUE | 22 µs | 45 µs |
Latency = rising edge on P0.05 to rising edge on P0.04 (first toggle in ISR).
Where the microseconds go
Breaking down Zephyr direct ISR path (logic analyzer + SWO trace approximate):
- Hardware vector → common entry — ~180 ns (Cortex-M33 vector fetch)
- Zephyr IRQ prologue — save context, switch to IRQ stack if configured: ~600 ns
z_gpio_isrdispatch — ~400 ns- Driver callback — ~300 ns
- GPIO register write via API — ~200 ns
- Epilogue — ~220 ns
CONFIG_IRQ_OFFLOAD and FPU lazy stacking (CONFIG_LAZY_FPU) add hundreds of ns if enabled — verify prj.conf.
prj.conf choices that affect latency
# Lower latency (trade isolation)
CONFIG_ZERO_LATENCY_IRQS=y          # use sparingly — breaks latency guarantees for others
CONFIG_ISR_DIRECT_GPIO=y            # when available for your driver

# Higher latency (default-ish)
CONFIG_SYSTEM_WORKQUEUE=y
# GPIO callback defers to thread context if using generic callback API wrong
Critical mistake: Using gpio_callback_handler that sets a semaphore and handles GPIO in a thread — fine for buttons, wrong for timing measurement labeled "ISR latency."
For motor PWM fault shutdown, use ISR_DIRECT pattern or bare-metal for that one pin.
Measurement code (Zephyr, direct ISR style)
Use GPIO_INT_EDGE with callback — document that this is not the fastest path:
static struct gpio_callback cb;

void btn_isr(const struct device *dev, struct gpio_callback *cb, uint32_t pins)
{
    gpio_pin_toggle_dt(&led);
}

/* in main */
gpio_init_callback(&cb, btn_isr, BIT(pin.pin));
gpio_add_callback(port, &cb);
gpio_pin_interrupt_configure(port, pin.pin, GPIO_INT_EDGE_RISING);
For apples-to-apples with bare-metal, compare IRQ_DIRECT_CONNECT macro path in Zephyr docs — bypasses some dispatch on supported drivers.
Bare-metal baseline snippet
void GPIO0_IRQHandler(void)
{
    if (NRF_GPIO->EVENTS_IN[5]) {
        NRF_GPIO->EVENTS_IN[5] = 0;
        NRF_GPIO->OUT ^= BIT(4);
    }
}
NVIC priority group: preempt priority 0, sub 0 for test — match Zephyr IRQ priority for fair compare.
Scheduler interaction
Enable CONFIG_THREAD_ANALYZER and load a second thread at priority 5 pinging I2C — Zephyr ISR worst case stretched from 2.4 µs to 3.1 µs. Not huge on nRF5340 at this config; on congested bus with logging, worse.
For scheduling comparison: FreeRTOS GPIO ISR measured 1.4 µs typical same setup — between bare-metal and Zephyr.
When Zephyr latency is acceptable
- BLE stack events, sensor polling at 100 Hz
- Button debounce paths (milliseconds)
- Protocol timing with microsecond slack
When it is not
- Hardware PWM trip on comparator (use hardware path, not GPIO ISR)
- Bit-banged protocol at multi-MHz (do not)
- Time-sensitive glue logic between two external chips
Reproducing on your board
- Loopback GPIO input to output on known pin
- Scope both pins, measure delta on 1000 external triggers (scope trigger tips)
- Build three firmware images: bare-metal, Zephyr ISR, Zephyr deferred
- Log
k_cycle_get_32()delta inside ISR if scope unavailable — less accurate due to measurement overhead
Document CONFIG_SYS_CLOCK_HW_CYCLES_PER_SEC — cycles to ns conversion.
Docs gap I filed upstream
Zephyr docs state "interrupts are fast" without numbers per architecture. I opened a docs PR suggesting architecture-specific benchmark notes — pending review.
Until then: measure on your silicon.
Power management caveat
Measured latencies above assume CPU running at full speed with CONFIG_PM disabled for the test. Entering idle between edges adds wake latency — on nRF5340 with CONFIG_SYS_POWER_MANAGEMENT=y, I saw an additional 1.2 µs typical before the ISR ran. If your product sleeps between events, benchmark in the actual sleep mode you ship, not just active mode.
What I would do next
Benchmark with CONFIG_LOG enabled at ERROR vs DBG — logging from ISR forbidden but background logging affects worst case via bus contention.
Test nRF5340 network core separately — different memory map, different radio ISR coupling.
Related
Zephyr vs FreeRTOS scheduling for context switch costs. Oscilloscope trigger cheat sheet for capturing rare worst-case edges.

Manish Bookreader
Electronics enthusiast, Embedded Systems Expert, Linux/Networking programmer, and Software Engineer passionate about AI, electronics, books, and cooking.