eBPF Observability in Production: A Cautious Adoption Story
eBPF programs that verify cleanly in CI can still cause latency spikes under specific kernel configurations. An honest account of our partial rollout.
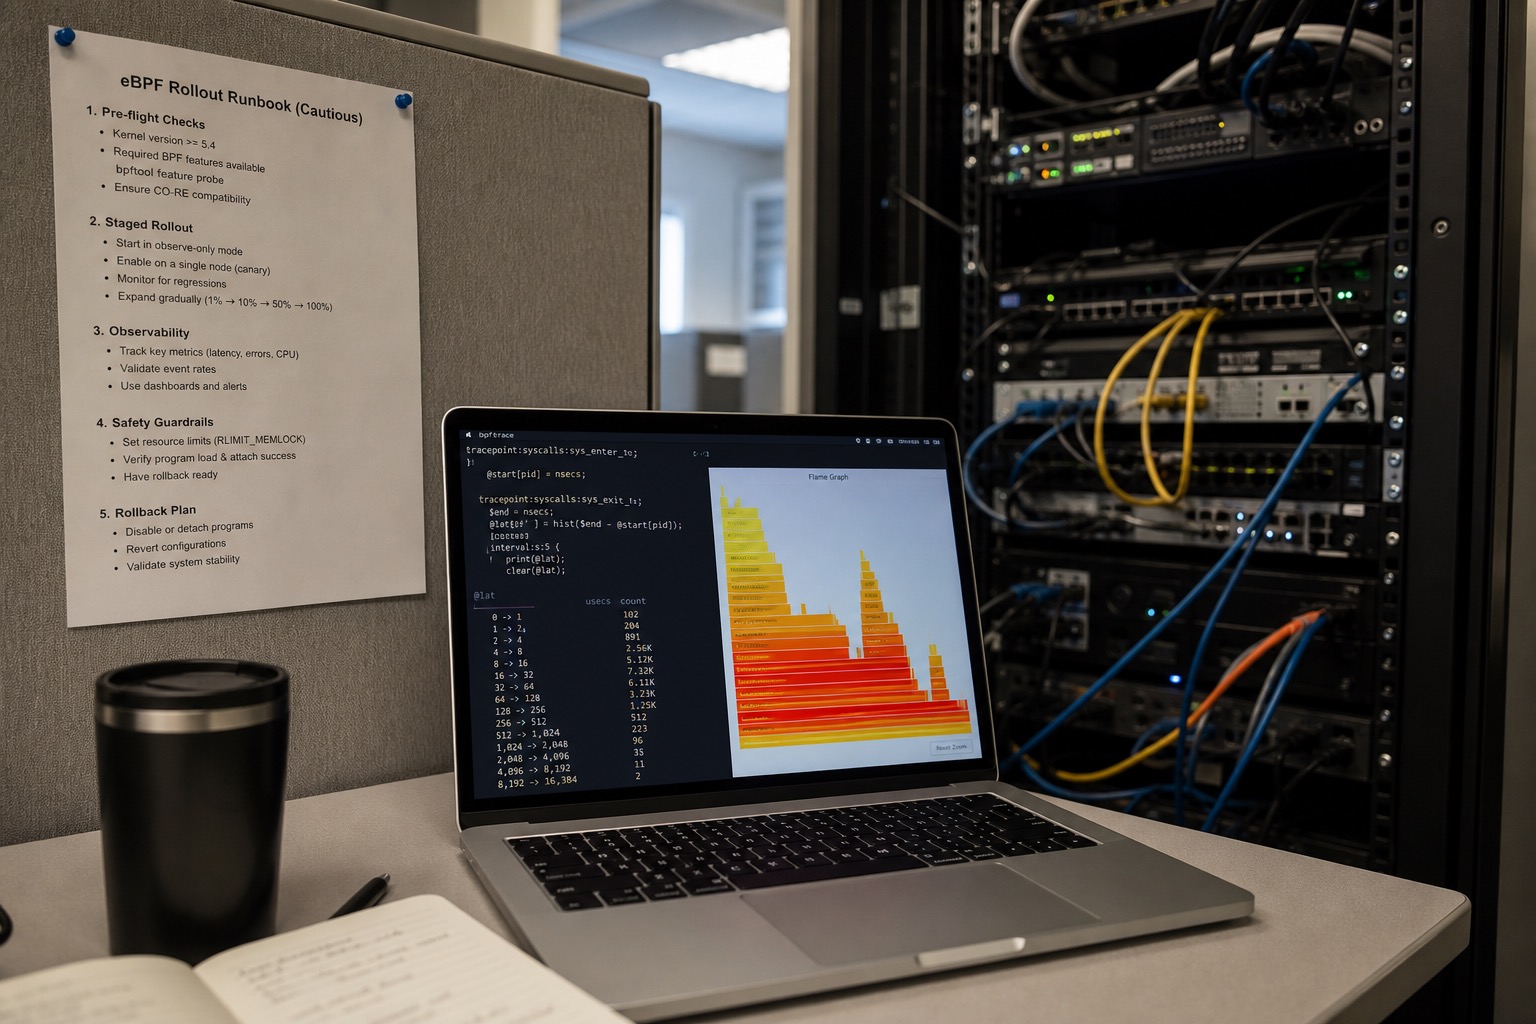
eBPF is excellent in demos and expensive in production if you treat verifier success as ship criteria. We rolled out Cilium hubble-derived custom programs and bpftrace one-liners across 40 nodes (Ubuntu 22.04, kernel 5.15.0-105-generic, CO-RE enabled) — then rolled back 60% of them after latency and lock contention findings. This is the cautious adoption story, not the conference talk.
What we deployed
| Program | Tooling | Purpose |
|---|---|---|
| TCP RTT histogram | bpftrace 0.20.1 | Per-service tail latency |
| Block I/O latency | libbpf 1.2 + custom CO-RE | NVMe stall detection |
| Syscall latency (select) | bpftrace | Debug only — removed |
| L7 HTTP trace | Cilium 1.14 Hubble | Service map |
Target cluster: 40 worker nodes, mixed m6i.2xlarge and c6i.4xlarge, ~800 pods.
What went well
CO-RE portability across 5.15 and 5.15 HWE kernels worked after we pinned BTF from matching linux-image-$(uname -r) packages in CI. Build once, deploy via DaemonSet with hostPID: false, privileged: true (unavoidable for kprobes on our kernel — CAP_BPF alone insufficient for some attach points).
TCP RTT maps at 1 Hz export to Prometheus via a small exporter (Go 1.21). Overhead unmeasurable on p99 application latency — <0.3% CPU on busy nodes.
Hubble for dependency discovery replaced manual service catalog updates. Worth it alone.
What broke
Latency spikes on 5.15.0-105 under high connect rate
Our kprobe/tcp_connect + kretprobe pair on nginx ingress paths added 2–4 ms p99 during connection storms (marketing event, 12k new conn/s). Verifier approved it. Production did not.
Root cause: retprobe overhead + map contention on a global hash with 65536 max entries. We switched to fentry/fexit on kernel 6.1 test nodes — improvement — but could not upgrade production fast enough. Program removed.
bpftrace syscall probe = observability DDOS
A well-meaning SRE deployed:
tracepoint:raw_syscalls:sys_enter { @[syscall] = count(); }
On a node running a buggy sidecar in a tight loop, this generated 400k events/sec, softlockup warnings, and lost metrics for unrelated pods on the node. bpftrace is a scalpel; we restricted it to break-glass SSH sessions with audit logging.
Ring buffer loss ≠ your app is fine
Perf buffer drops showed up under memory pressure before application logs did. If you alert on eBPF metrics without lost_events counters, you are flying blind. We added bpf_ringbuf loss export — non-zero for 60s triggers page.
Verifier vs production kernel config
Programs that load on CI kernels failed on production when CONFIG_DEBUG_INFO_BTF was disabled on a stray autoscaling node pool built from an older AMI. We now gate node joins on an init container that runs bpftool feature probe and refuses scheduling if BTF is missing.
Similarly, kernel.perf_event_paranoid and kernel.kptr_restrict affect stack symbolization — not latency, but incident response time. Set paranoid ≤ 2 on observability-tainted nodes or accept opaque addresses in flame graphs.
Adoption rules we enforce now
- No kretprobes on hot paths without canary on 5% of nodes for 72 hours with automated latency compare (Mann-Whitney on p99 HTTP latency).
- Every program has a kill switch — ConfigMap flag checked every 30s; bpf pin paths in
/sys/fs/bpf/obs/. - Max stack depth 512, max instructions 1M — stricter than verifier minimum.
- CI runs
bpftool prog load+ 10 min stress against recordedperf scriptworkloads. - Kernel minor version homogeneity within a pool before fleet-wide attach.
cgroup v2 interaction
Memory pressure from eBPF maps (especially per-CPU arrays on 128-core metal) counts against cgroup limits. We hit this on a test pod with memory.limit=256Mi running a careless LRU map — OOMKill unrelated to app heap. Ties directly to cgroups v2 memory accounting.
What stayed in production
- Hubble L3/L4 (Cilium-managed, supported path)
- TCP RTT histogram (CO-RE, fentry-based on upgraded 6.1 canary pool — 8 nodes)
- Block I/O latency on database nodes only (12 nodes, dedicated taint)
Everything else requires a ticket citing which decision cannot be made without it.
Cost accounting
Hubble and managed Cilium observability run ~$180/month per 40-node cluster in AWS — acceptable. Custom bpftrace programs cost engineer review time on every kernel bump; we cap at 3 custom programs per pool.
One softlockup incident tied to syscall tracing cost four engineer-days postmortem plus fleet rollback — cheap tool, expensive misuse if governance is loose.
What I'd do next
Move to Tetragon 1.0 policy-as-code for the security team's asks instead of ad hoc kprobes — same kernel surface, better lifecycle.
Standardize on 6.1 LTS fleet-wide before expanding custom programs; fentry/fexit overhead profile is materially better in our benchmarks.
For network path debugging that does not need kernel hooks, prefer namespace routing checklists — cheaper than permanent probes.

Manish Bookreader
Electronics enthusiast, Embedded Systems Expert, Linux/Networking programmer, and Software Engineer passionate about AI, electronics, books, and cooking.