Linux cgroups v2 and Container Memory Limits: What the OOM Killer Sees
Kubernetes memory limits and cgroups v2 interact in ways that surprise engineers who learned on v1. A precise look at where the accounting differs.
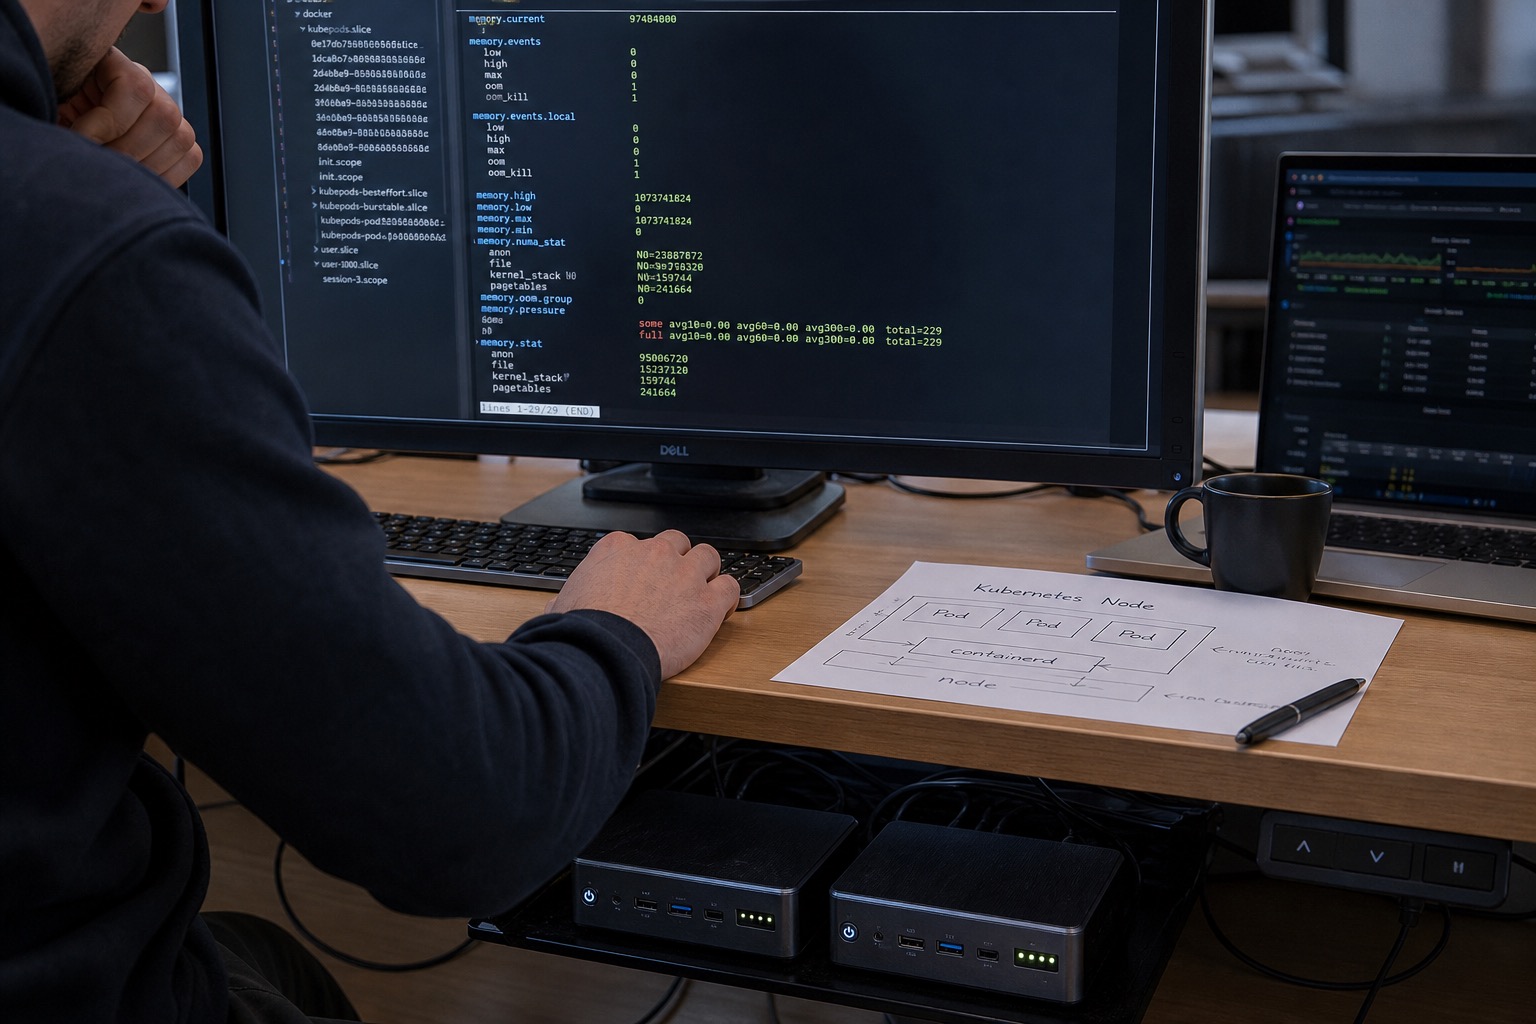
Kubernetes resources.limits.memory does not mean what most engineers think it means on cgroups v2 — and the OOM killer's view of your pod is assembled from accounting rules that differ materially from cgroups v1. We lost a week to "mysterious" OOMKills on EKS 1.28 (AL2023, kernel 6.1, cgroup v2 unified hierarchy) before mapping kernel behavior to pod spec fields.
The symptom
Java service, heap capped at -Xmx512m, container limit 768Mi, requests 512Mi. Pod OOMKilled at ~620 Mi according to kubectl top — but cgroup memory.current at kill time was higher. Metrics showed RSS flat; something else was charged.
What the OOM killer actually scores on v2
On unified cgroup v2, memory pressure for OOM purposes uses memory.current, which includes:
| Component | Counted in memory.current (typical) |
|---|---|
| Anonymous RSS | Yes |
| Page cache (file-backed, clean) | Partially — memory.stat splits file, anon, kernel |
| Kernel memory (sock, shmem) | Yes, subject to memory.kernel limits if set |
| Swap | Tracked separately; swap usage does not reduce pressure the way people expect when memory.swap.max is unset |
Critical v1 → v2 shift: no separate kmem cgroup in the default unified setup. Kernel allocations attributed to the cgroup count against the same limit as user memory. On v1 + kmem limits, Java native memory could OOM the kmem counter while RSS looked fine. On v2, everything lands in one bucket — simpler model, different surprises.
Check your hierarchy:
mount | grep cgroup2
# expect: cgroup2 on /sys/fs/cgroup type cgroup2
cat /proc/1/cgroup  # 0::/ on v2 unified
Kubernetes mapping (EKS 1.28, containerd 1.7)
Pod with limit 768Mi sets:
/sys/fs/cgroup/kubepods.slice/kubepods-burstable.slice/.../memory.max = 805306368
memory.max on v2 is a hard cap — OOM kill when exceeded (modulo OOM score and sibling cgroups).
What does not always show up in kubectl top:
- Page cache for files mapped or read inside the container
- tmpfs usage (
emptyDirwithout medium,/dev/shm) - Off-heap native allocations (Netty direct buffers, gRPC, RocksDB block cache if colocated)
Our Java pod had 180 Mi in anonymous and ~240 Mi in file cache from JAR mmap and log tailers — total over limit.
memory.high vs memory.max
Cgroups v2 introduces memory.high — throttling before kill. Kubernetes 1.27+ can expose this via Alpha features; most clusters still only set memory.max via limits.
If you run bare systemd-nspawn or custom orchestration, setting memory.high to 90% of memory.max gives reclaim a chance to run before SIGKILL. In Kubernetes today, you mostly get hard kill.
PSI and what to alert on
Use Pressure Stall Information instead of only RSS:
cat /sys/fs/cgroup/.../memory.pressure
# some avg10=... full avg10=...
We alert on memory.pressure full avg10 > 10 for 5 minutes, not on RSS > 80% of limit. RSS-only alerts missed cache-driven pressure.
Pair with node-level checks — sibling pods on the same NUMA node can drive reclaim that hits your cache. Related instrumentation patterns in eBPF observability in production.
Pod overhead and init containers
Kubernetes 1.28 adds pod-level cgroup in some configurations (Kubepods-podXXX.slice). Sidecars share the pod cgroup memory limit in certain runtimes — check whether your cluster enables Pod cgroup v2 driver. We hit a case where app + log sidecar + istio-proxy shared one 1 Gi limit; each container's individual limit was ignored for OOM scoring on older patch versions. Verify with your platform team before trusting per-container limits alone.
Init containers that spike memory during pip install can OOM the pod cgroup before the main container starts — set init resource limits explicitly or use pre-built images.
Swap and zswap on nodes
Even with memory.swap.max=0 in the pod cgroup, node-level swap can cause latency outliers that look like memory pressure. We disable swap on EKS worker nodes (kubeletConfiguration.failSwapOn: true) for latency-sensitive Java services. If swap is enabled for cost reasons, treat memory.current alerts as higher severity — reclaim stalls precede kill by minutes.
JVM-specific trap
-Xmx512m is not -XX:MaxDirectMemorySize, not metaspace cap, not thread stacks. On cgroup v2, set:
-XX:+UseContainerSupport
-XX:MaxRAMPercentage=65.0
And measure with Native Memory Tracking (jcmd VM.native_memory summary) before trusting heap metrics alone.
Debugging checklist
kubectl exec→cat /sys/fs/cgroup/memory.currentandmemory.maxmemory.stat— readanon,file,shmem,sock,kernel_stack- Check
dmesgforMemory cgroup out of memory: Killed process ... - Verify swap:
memory.swap.current— if swap is enabled on node, latency spikes precede OOM - Confirm v2:
stat -fc %T /sys/fs/cgroup/should printcgroup2fs
What I'd do next
Standardize a sidecar mem inspector on staging that dumps memory.stat every 30s to Prometheus — cheap cardinality if labeled by deployment only.
For io-heavy sidecars on the same pod (log shippers), split to a separate pod or account for cache in limit math (+30% headroom minimum on our workloads).
Edge nodes running the same stack on A53 boards show the same accounting — see io_uring edge notes for how memory bandwidth interacts with I/O-heavy companions.

Manish Bookreader
Electronics enthusiast, Embedded Systems Expert, Linux/Networking programmer, and Software Engineer passionate about AI, electronics, books, and cooking.